
The objective of this post is to share some of the stats from the last Olympic Games on the women’s side.
This data has been published by FIH.
Although I will share some stats, the idea behind this post is not only to present what the numbers are showing, but also try to put them into context, trying to challenge the way we understand and use stats.
First, let’s take a quick look at the total numbers of goals and where they came from:
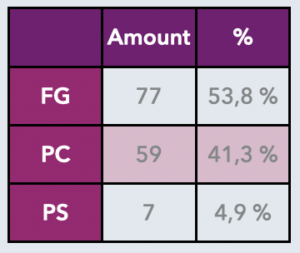

In total, 143 goals were scored in 38 matches, given an average of 3,76 goals per game.
Now let’s analyze each team more in detail.
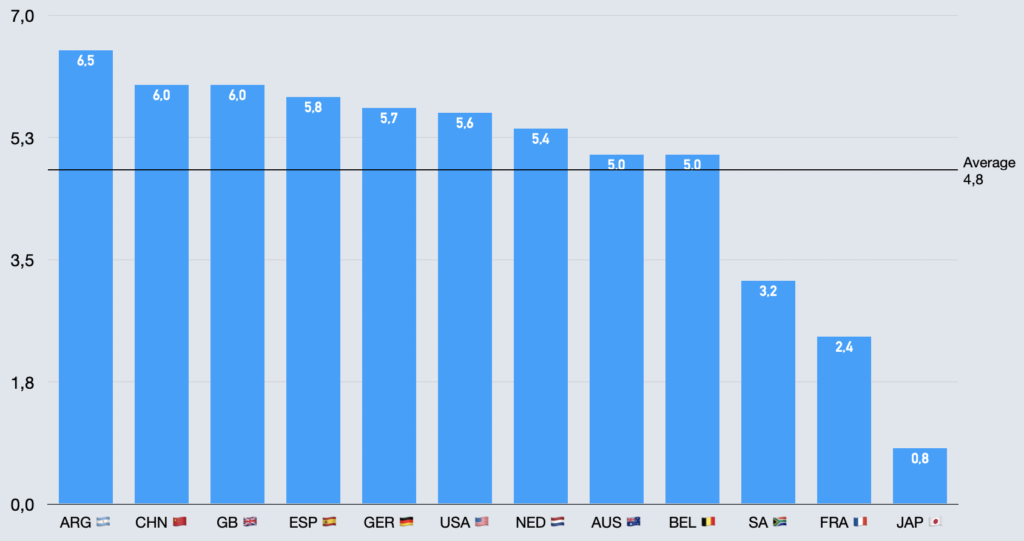
The first stat we will see is the goals per team per game:
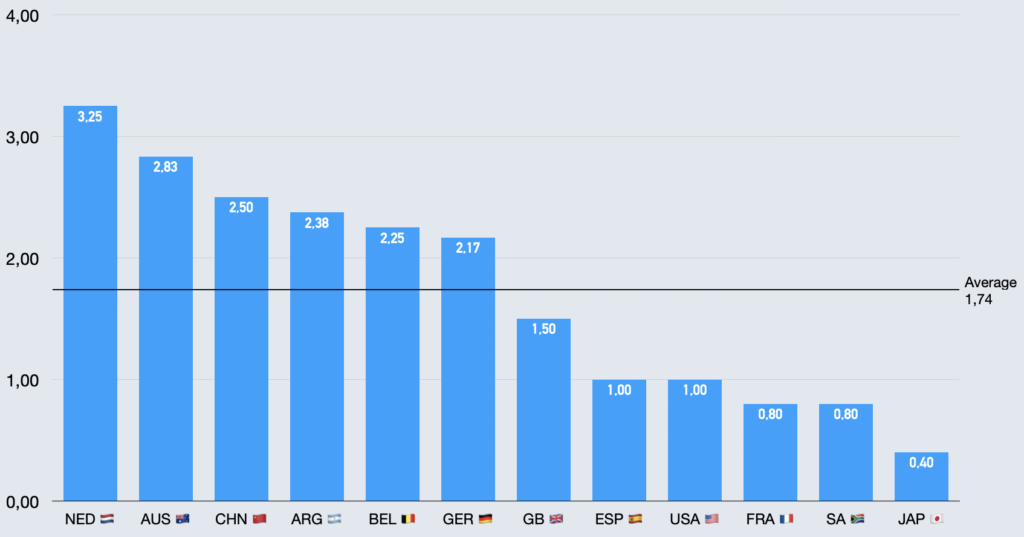
Something we need to clarify already, most stats are made as an average per game played. The top 4 teams played 8 games, while the teams that lost in quarter finals played 6 and the ones that didn’t make it through the pool only 5.
China was the second teams with most goals scored in the tournament (20) but that was in 8 games. Australia scored 17 but in 6 games, making their average better.
First consideration to put stats into context: Can we consider the average “per game” totally fair?
My personal answer: No. Teams are likely to have more chances of scoring goals in the pool games against lower ranked teams than in crossover games against the top teams of the tournament.
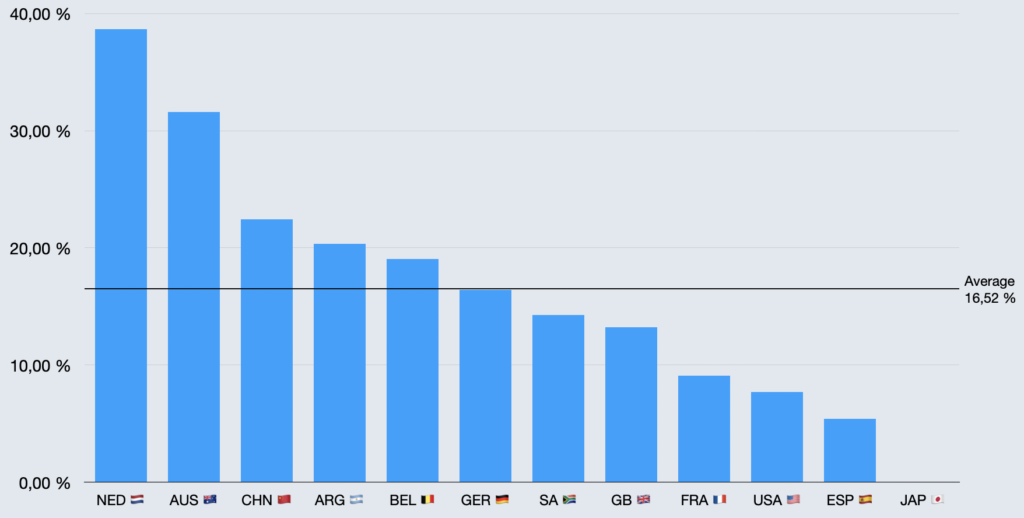
Next stat we will see is the amount of circle entries per game:
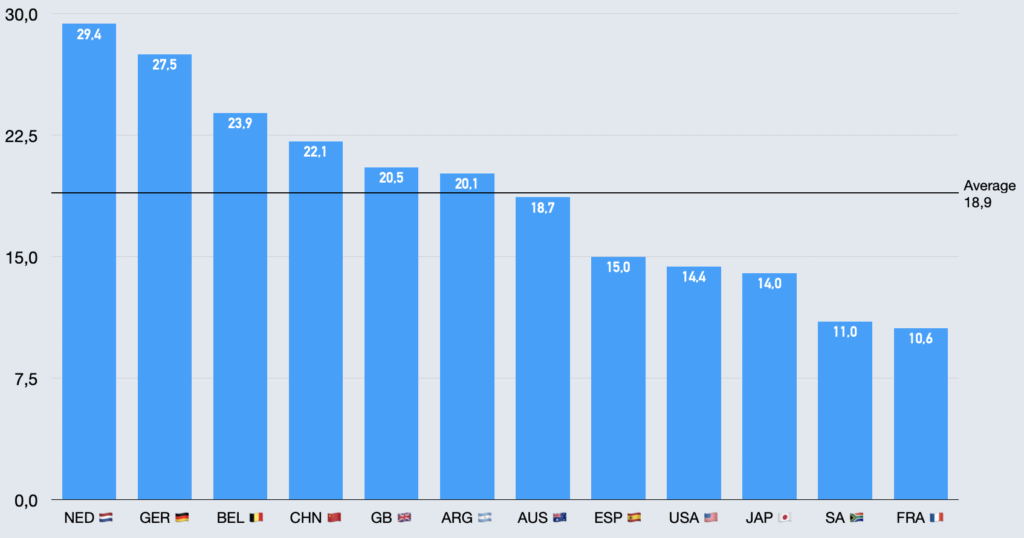
Again no surprises: The dutch dominating this attacking area. Germany has a really good average as well.
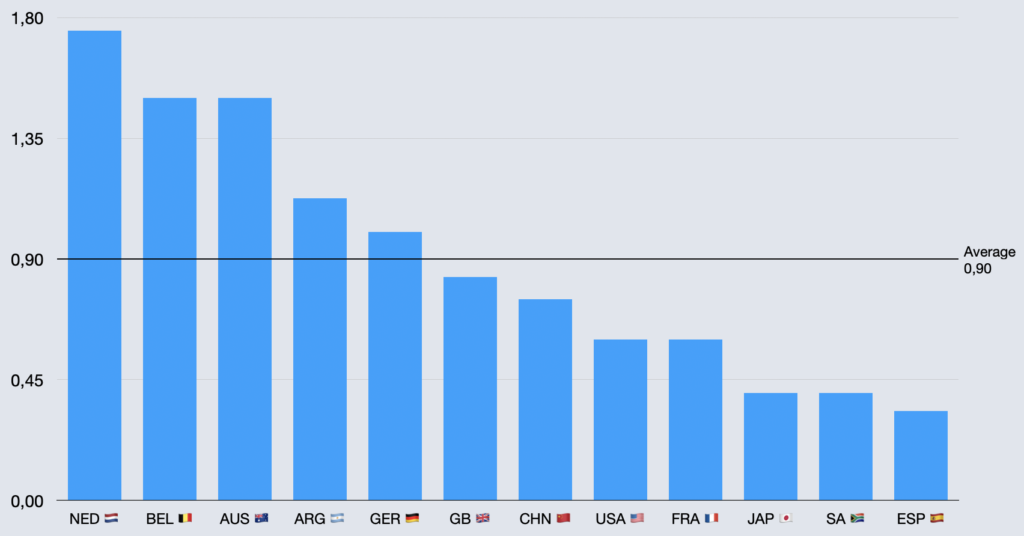
Next area: PCs earned per game
Something we must clarify: This is the total amount of PCs per team, to do a more realistic analysis we should probably check in every game which PCs come from retakes.
Argentina leading on this area. Surprisingly the dutch are quite low on this ranking.
South Africa, France and Japan clearly far away than the rest of the group.
Given the surprise of the dutch in this area, specially after being the leaders in the Circle Entry stat, I went into detail to check the amount of PCs earned per Circle Entry they had, Interesting results:
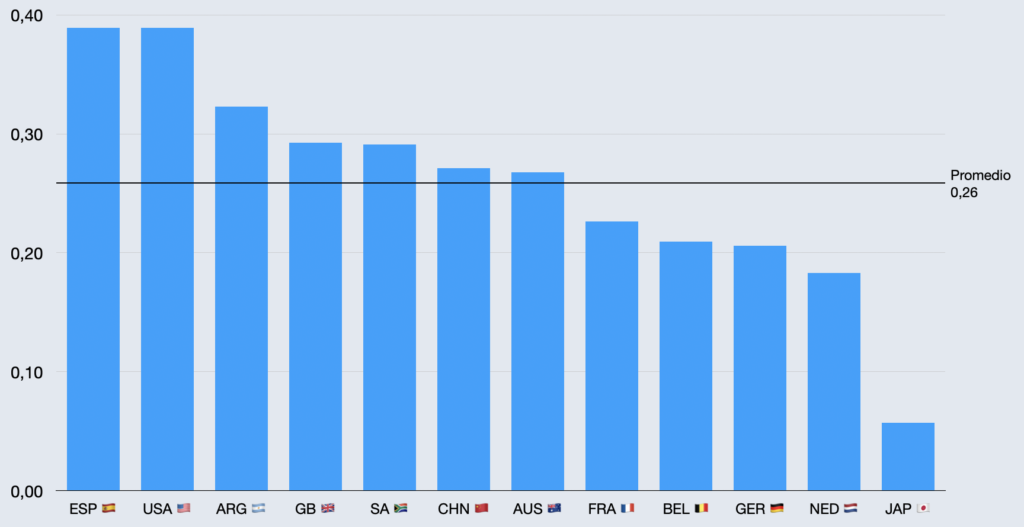
Spain and USA leading on this one. This means that 40% of the circle entries that USA and Spain finished in a PC (again not counting retakes).
As foreseen based on the previous statement, the dutch are very low on this ranking.
Question: Does this mean that USA/Spain played their circle entries better than the dutch?
My personal opinion: Not necessarily. And this is a great example of why stats must be considered in context.
When the Dutch play, in most of their games, they dominate. This means most of the game is played in the attacking half, with teams defending low and with numbers.
Spain and USA had much less CE per game than the dutch (almost half). Most of this CE probably come from breaks and counters, with defenses more open.
And again, that is just an assumption. To have a deeper understanding of the quality of circle attack, in my opinion, for example, another point that could be considered is the number of defenders from the other team in every circle entry.
Now, we can’t judge the quality of the circle attack only based on the PC earned. A goal is always a better outcome than a PC.
Let’s look at the number of field goals per team:
This makes more sense now, the dutch didn’t have too many PCs but they are leading the field goals ranking. China and Spain are a bit the surprises here on how low they rank.
Now we will look at the PC efficiency:
Australia and Netherlands both over 30% is really high.
USA, Spain and specially Japan really low. This is one of the main reasons why these teams didn’t achieve great outcomes.
Finally, I made a graph to show all the Circle Outcomes together:
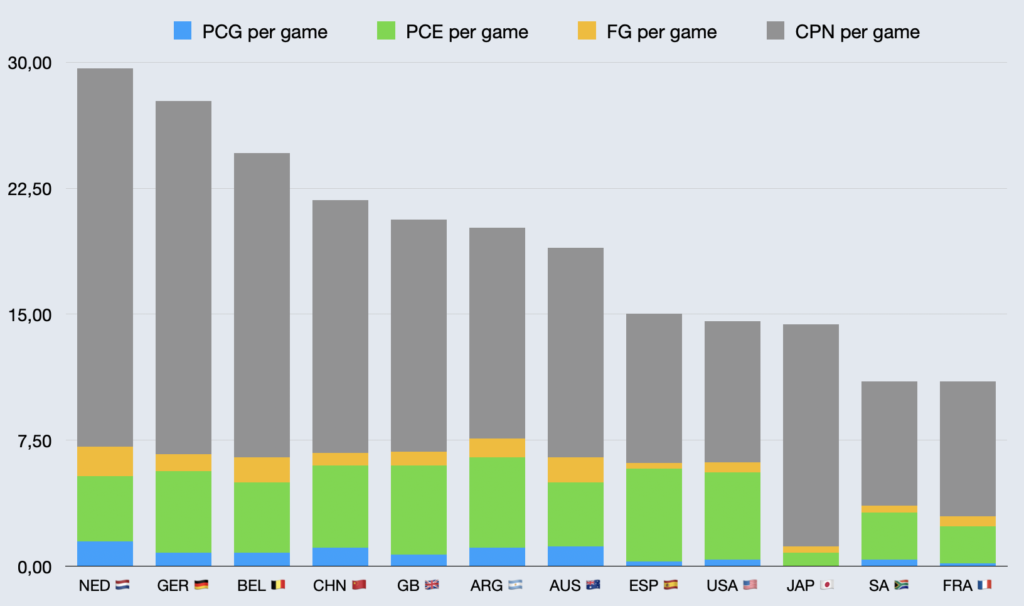
So, basically what I’m trying to show in this graph is all the Circle Entries and outcomes per country,
The sum of all colors, is the amount of CE.
The yellow is the field goals they scored.
Green + Blue: PCs earned.
Only Blue: PCs scored.
What I find interesting in this graph is the fact that, even though on the total amount (top of the bars) there are big differences, like that dutch having almost double than other countries, on the outcomes part is really even (Yellow + Green + Blue).
Only Japan, South Africa and France are apart from the group on this one.
To finish, the last graph I created was the same one, but sorted by amount of outcomes:
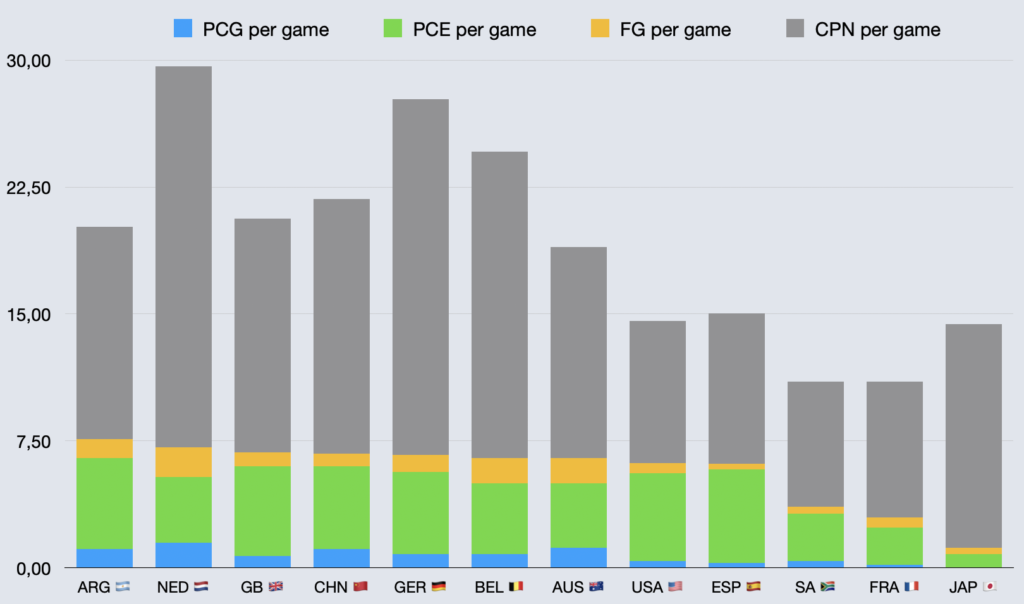
Argentina has been the team to create more outcomes from their Circle Entries. GB had a really good performance as well.
Then in countries like USA and Spain, as we said before, you can see a lot of outcomes created (blue+gree+yellow) but very small conversion (blue / yellow).
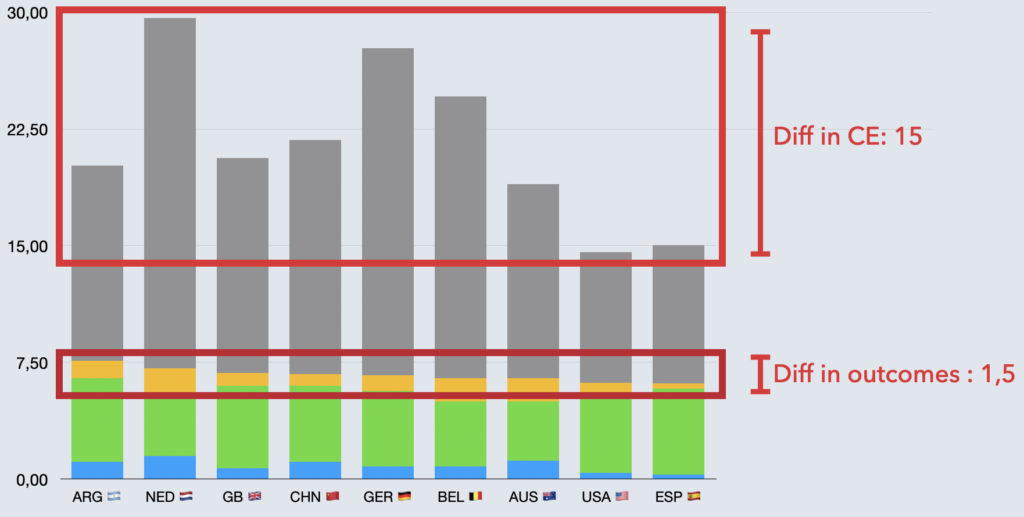
This information can be analyzed differently by each person, and, although I included many of my thoughts into the post, the main objective is to get people thinking about what this actually means.
The only thing we can say here is that by the looks of the last tow graphs, having much more circle entries, in this tournament, has not been translated to more outcomes. At least for the top 9 teams.
Would love to read some of your conclusions!
Hope you enjoyed the read!
thank you Javier!!
I will study your work
Thomas
Muy bueno javi! Excelente como siempre!
Se me ocurrió como una conclusión q la diferencia entre Paises bajos y el resto es la eficacia. Que parejo está todo!!
Very interesting ! Gracias Javi
Muy bueno Javi! muy buena data como siempre! Creo que estaría bueno encontrar (la estoy buscando) esa misma data pero en faz defensiva, creo que por ahí también nos diga algo sobre todo a partir de los cruces en este tipo de torneos.
Mas allá de los datos, creo que el dominio de PB es superlativo, desde los ultimos 5 JJOO + Pro league y que de ahí hacia abajo se ha emparejado bastante con equipos como Aus, Arg, Bel, China, GB. Abrazooo!
Your blog is a breath of fresh air in the often stagnant world of online content. Your thoughtful analysis and insightful commentary never fail to leave a lasting impression. Thank you for sharing your wisdom with us.